Monday, January 31, 2011

Building the harvest trolley

Here is a glimpse of what it takes to build the harvest trolley, probably not a simple DIY undertaking for many.

DIY is actually very time consuming in nature. Making improvements through iteration is also part and parcel of it. It takes time and efforts on matters that appear trivial. Frequent trips made to the hardware shops to find the right materials & sizes etc.

A steel supplier in town that provides us the commonly needed items.


Yaowarat (Chinatown), Klong Thom and Baan Mor areas in Bangkok has a vast variety of businesses spanning consumer wholesale to specialized industrial parts. Though in close proximity to each other, it is a vast area with honeycomb web of shops in the thousands.

Looking for parts here is a task itself. Specialty shops tends to congregate in various pockets but spread out. One needs local knowledge to navigate around. The degree of their specialization is remarkable. For example this shop specialize in gears & belt pulleys only, others could be just just bearings, screws & nuts, electrical & control gears, electronic spares etc.


Parts needs to be machined are outsourced to a local workshop.


After the initial prototype, a second round of parts procurement followed. Drive shaft needed to be machined to fit the bearings etc. My friend P'Wah did most metal work in-house to complete the assembly.

Two new motors are selected for trials with 6" wheels. One axial:


The other is orthogonal to the drive axis.


An industrial grade control joystick is next upgrade.


So are the other free-wheeling 6" wheels.
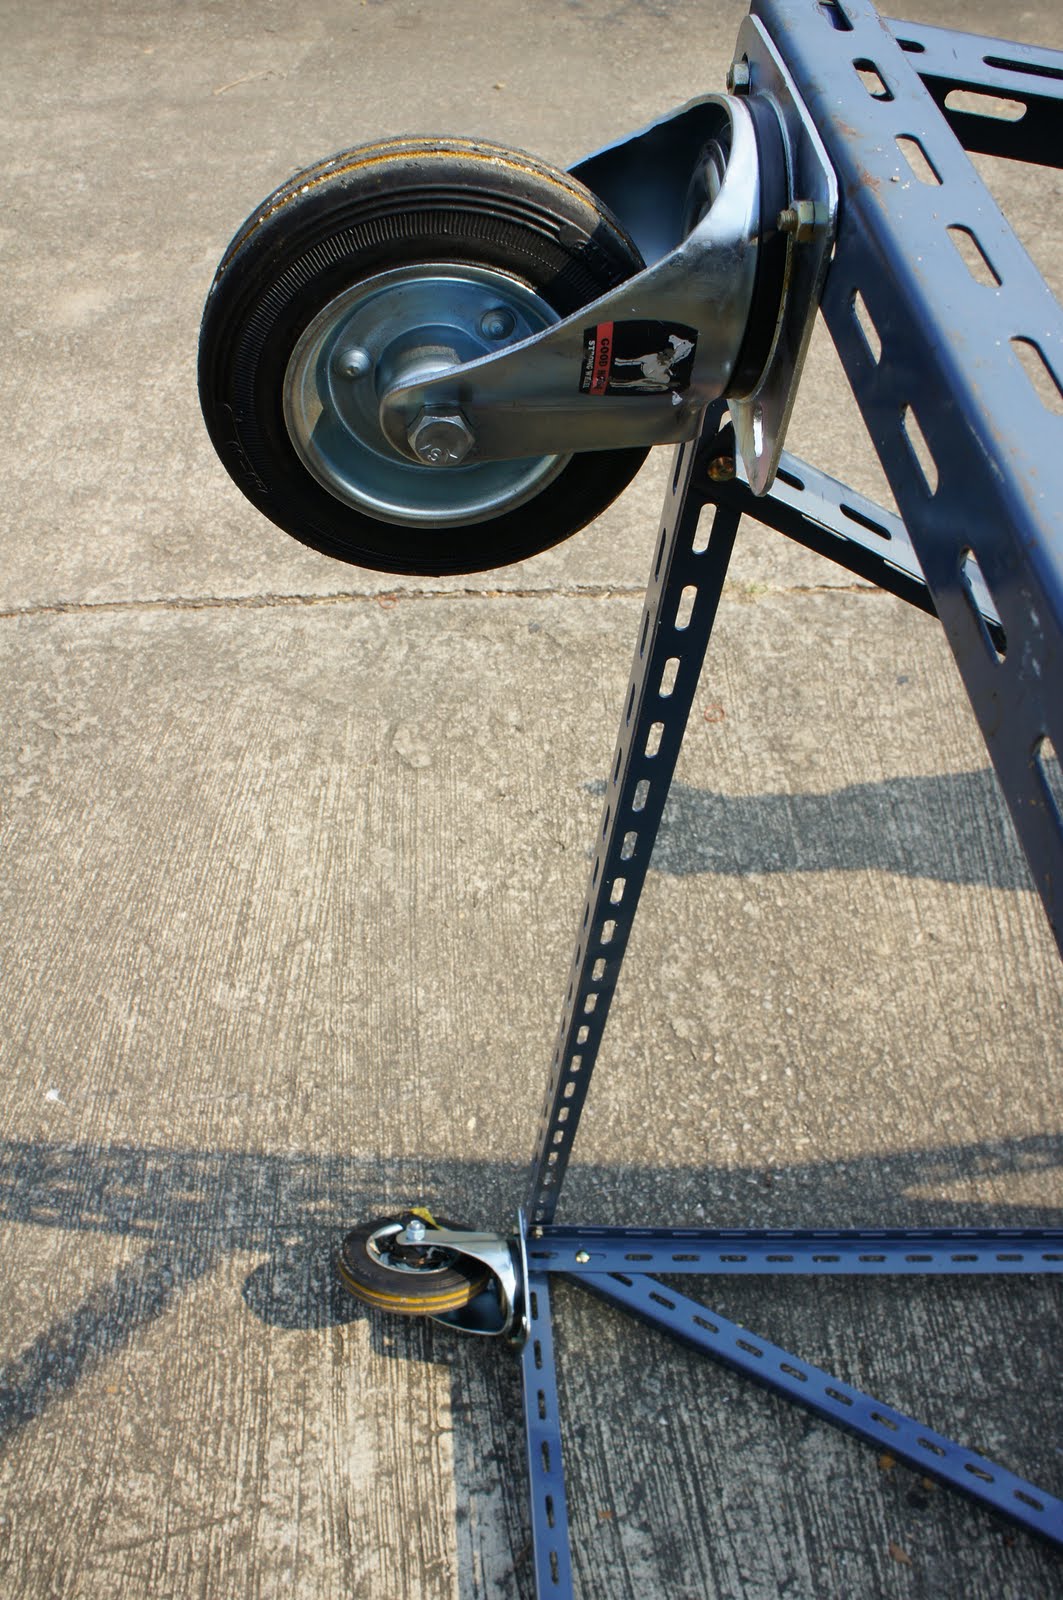


Soon we shall test drive the improved version.
Lots of effort input no doubt, but the reward to see it through is very satisfying.

The other part of experience was to soak in the hustle and bustle atmosphere of Bangkok Chinatown. I would observed how every available space is utilized to the limit and how each individual makes a living within this chaotic space. Yet there is an order in this apparent chaos.

Amongst it are heritage of beautiful Chinese temples, traditional shops etc.
A taste of Chinese herbal drink here - it's rather bitter and took it all in one gulp.


Last but not least, discover the best Chinese food in Bangkok Chinatown!

Monday, January 24, 2011

External tweeters - a final note on safety

Just a word of caution should you be working high up at entrance hole area, it is prudent to have a secured working platform. Mine has adequate standing room to move about & don't obstruct to incoming birds.


In addition, I would use safety harness when working here on extended period.


Only problem is pigeons find it a nice nesting spot!

Power dispersion of external tweeters

How do I install the external tweeters with due consideration to power dispersion?

A hypothetical 'balloon' shape profile illustrates the power dispersion mounted square to the entrance hole in 2-D horizontal plane, typical of installations commonly seen. Multiple tweeters simply extend the range but do not alter the profile.


If two tweeters are angled from the central axis by 45 degrees in opposite directions. The resulting power dispersion is wider spread and more evenly distributed.


Furthermore I tilt the tweeters pointing skyward by another 45 degrees. This will reduce sound power projection to ground level.


The steel mounting strips are bent 45 degree backwards and positioned at 45 degree at the corner of entrance hole.


Visualize the intersect of 2 balloons in 3-D space. The space of volumetric intersection has extended range.

I prefer the twin tweeters - if one side fails, you still have 1/2 power.

Better low frequency coverage?

It is really a simple (& no brainer) solution if you think your tweeters are inadequate at lower frequencies. Just compliment it with a normal speaker - just as in any loud speaker box.

This is the set-up at one of my bird houses. Though I think it may not be necessary, I did it a while ago just to see if it works better. If the tweeter performance is characterized, it will take out the guess work.


The paper cone speaker should be sheltered from weather with an aluminum screen. (I'll update with a picture next).

So there is no need for alarm when people posed question "Your birds may not hear the low frequencies". The dummy approach is to cover low end with a speaker.

We should actually counter-ask "What low frequencies?" When we know truly the frequencies of the bird calls only then we know the required bandwidth of the tweeter. Otherwise it is simply guesswork.

Tuesday, January 18, 2011

Tweeter Testing - Part 3

Case study of alternate method.

A friend sent some tweeter test charts for my information which is useful to illustrate an alternate approach. He has kindly given consent for its post here. The tweeter is Indonesian branded with label erased to maintain anonymity.

The measurement is made by an audio sound analyzer. In essence, it is a frequency response plot except a bird sound profile is used here (vs a pure sine wave test signal as in lab test). In addition it provides measurement of sound level with respect to its frequency content.

This is an alternative in what I regard as a "next best" test. Such method are normally employed by sound engineers in the field to sample sound quality at different spots in auditoriums, stadiums, event stage etc.


Reading the chart:

The horizontal axis of the graph is in logarithmic (log) scale. This is common in frequency response plot where incremental step (of equally spaced vertical scale lines) along the x-axis means 10 times increment in frequency. e.g. 20 Hz, 200 Hz, 2KHz, 20KHz etc.

The vertical axis is the measure of SPL (sound pressure level) in dB, which is also logarithmic in nature. 0 dB is about the threshold of human hearing, that of a mosquito flying 3m away! Can you hear that? I can't. Each 20 dB increment is 10 times louder (rather similar to Richter Magnitude scale for earthquakes), 40 dB is 100 times, 60 dB is 1000 times etc.

The vertical bars (in lighter shade of blue) are the frequency components of the sound profile.

Finally the solid line (brownish?) is the profile of the measured sound. Be aware it is the combination of the tweeter & amplifier responses together.

So this is a comparative test between the "envelop" of the sound source and the measured response - not truly of the tweeter alone.

The circled area on graph highlights gross mismatch in performances.

"Apparent" frequency response between 20Hz to 1KHz are relatively flat whereas there are peaks in mid-region of the sound profile of the same range.

As the lowest frequencies used by the swiftlets in echolocation are reportedly between 1KHz to 6KHz, you may question why are there frequencies lower than 1KHz in the bird sound profile? Do the birds create them?

No, in my opinion. This require some understanding of signal theory & Fourier Transform analysis to explain (beyond the scope of discussions here).

Let me try to put in lay terms. The time intervals between echolocation calls itself is a frequency component in the recorded signals. There are random variations between calls as one can expect in a sound profile. So these are not acoustic waves in swiftlets sound per se.

The frequency plot is an analysis of the time signals by Fast Fourier Transform computations. Any non-ideal sine waves will have its range of harmonics generated too.

The bird sound profile is a complex sound with it frequencies content changing all the time. So the analyzer only register the peaks - that forms the envelop. Hope it is evident here why a pure sine wave test signal give a much more objective measurement.

What's more - the tweeter seem to reproduce these frequencies too - note readings just below 60dB on graph! Not quite true. This is likely the lowest measurement limit (or sensitivity) of the instrument though part of it could be ambient noise level which may be disregarded. Note the higher sound levels are > 90dB, almost 40dB (100 times) higher.

In general this gives an overall good picture how "faithful" is the reproduction of the "original" sound. One has to interpret the result with discretion.

This is a still good method to match a sound profile for tweeter selection. On the other hand if you have a tweeter measured with adequate frequency response, it will match any sound profile within the frequency range.

Hope I provide here an understanding to the relative merits of the two methods.

Knowledge + Action = Power

Those of you with a tireless quest for knowledge would relate to this statement.


You may wonder if it is necessary to go into such detail to study tweeter performance. We all know how important the bird sound is. Hence all related matters, from the sound system to the bird sounds are subjects of my study.

Many wondered why I have the courage to build a large bird house - considered a rather risky undertaking at the first attempt.

It is not because I am over confident (may be foolhardy), it is more of an attribute to think through the details and acquire the required knowledge base. I have a mental picture in every aspects of my bird houses - in depth & crystal clear. It is not perfect but I do know where the deficiencies are. I may not know everything, I am probing the unknown one step a time - that's my attitude.

Ever wondered why 80% don't make it? I rather spend energy to place myself in the other 20%.

Ever wondered why the Germans produce the Audi, Mercedes & BMW? In my professional life, I had the privilege of working with top design engineers at Siemens in Germany.. it is no accident why they are top rate. They are simply meticulous in every aspects!

Anything they can express with a mathematical formula - they would; even just to convey an idea. That's how precise they are.

Tweeter Testing - Part 2

This is how my "Tweeter Test" set-up would be. Of course, it is essential each part of the test set-up be instrument grade.


A "pure tone" test signal that sweeps across the entire audio range (as mentioned in Part 1) is played through the test tweeter and recorded. The recorded sound profile would then be analyzed to provide a frequency response curve (such as one shown below). This is a "proper test" to characterize the performance of the tweeter. How good a tweeter is judge from this graph.


Another test to measure the dispersion of sound power is to rotate the tweeter and measure the SPL (sound pressure level) in every direction. The measured result is depicted by a polar plot shown below. This provides a measure of the relative strength of sound power distribution all round in 360 degrees.


The tweeter may be rotated 90 degrees to measure the power distribution & polar plot along a different axis. The power distribution from the tweeter is 3-D in reality. You may visualize it in the form of a 'balloon' pointing forward. The 'balloon' shape would vary with different tweeters.

Above tests are to conduct in environment without sound reflection. To achieve that I would conduct the tests at roof top with sound source pointing towards open space. The recording microphone should be shielded from wind noise.

Hope this gives an idea how tweeter performance may be measured scientifically.

Hopefully you can be adequately informed to distinguish "wishy-washy" materials floating in cyberspace.