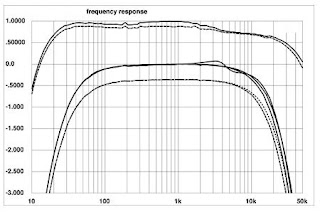
A "pure tone" test signal that sweeps across the entire audio range (as mentioned in Part 1) is played through the test tweeter and recorded. The recorded sound profile would then be analyzed to provide a frequency response curve (such as one shown below). This is a "proper test" to characterize the performance of the tweeter. How good a tweeter is judge from this graph.

Another test to measure the dispersion of sound power is to rotate the tweeter and measure the SPL (sound pressure level) in every direction. The measured result is depicted by a polar plot shown below. This provides a measure of the relative strength of sound power distribution all round in 360 degrees.

The tweeter may be rotated 90 degrees to measure the power distribution & polar plot along a different axis. The power distribution from the tweeter is 3-D in reality. You may visualize it in the form of a 'balloon' pointing forward. The 'balloon' shape would vary with different tweeters.
Above tests are to conduct in environment without sound reflection. To achieve that I would conduct the tests at roof top with sound source pointing towards open space. The recording microphone should be shielded from wind noise.
Hope this gives an idea how tweeter performance may be measured scientifically.
Hopefully you can be adequately informed to distinguish "wishy-washy" materials floating in cyberspace.

No comments:
Post a Comment